

Raspberry Pi Debug Probe
The Raspberry Pi Debug probe, Raspberry Pi's first foray into debugging hardware, is a delighful little device, offering all the essential functionality at an approachable price. There are some minor quirks and omissions - but they don't meaningfully hold the probe back at all. Definitely worth checking out!
Pros
- Open-source and inexpensive
- Great UART and SWD performance
- Supports standard CMSIS-DAP protocol
Cons
- A tad difficult to initially set up
- No JTAG capabilities
- Still uses Micro USB
The excitement around Raspberry Pi’s product releases is always massive – their products, shaped by years of community (and top-notch first-party) support are representative of the way a piece of development tech is meant to function. From perfectly stable SBCs with mature OSs to the Raspberry Pi Pico MCU board which has been a community favourite since its 2021 debut, ease-of-use and and a highly polished user experience differentiate the company’s offerings from those of its rivals.
The Raspberry Pi Debug Probe which we’re taking a look at today explains its purpose quite splendidly by name alone: it’s an open-source debug probe providing both an UART and an ARM SWD interface, all at a very attractive $12 price.
Before we continue, we’d like to thank Raspberry Pi for providing us with the units used in this review.
Raspberry Pi Debug Probe Specs
There’s not a lot to say about the Raspberry Pi Debug Probe specs-wise, as it’s basically a small-format RP2040 development board running the custom picoprobe firmware. This firmware can also be run on any standard Raspberry Pi Pico (and other RP2040-powered boards, too), so it’s not unique to this probe – but creating a standalone product based around it hopefully points to longer-term commitment plans. Both the hardware and the software are open-source, which might be an important factor for some.

Raspberry Pi’s 3-pin Debug Connectors make an appearance here, as well. Sadly, so does a Micro USB port situated along the top. We feel this could, and dare we say, should have been a USB-C port. We understand the need for cutting corners when designing a budget-conscious product, but we also feel that a modern connector would have justified and even made a minor retail price increase feel worth it.

Look and feel
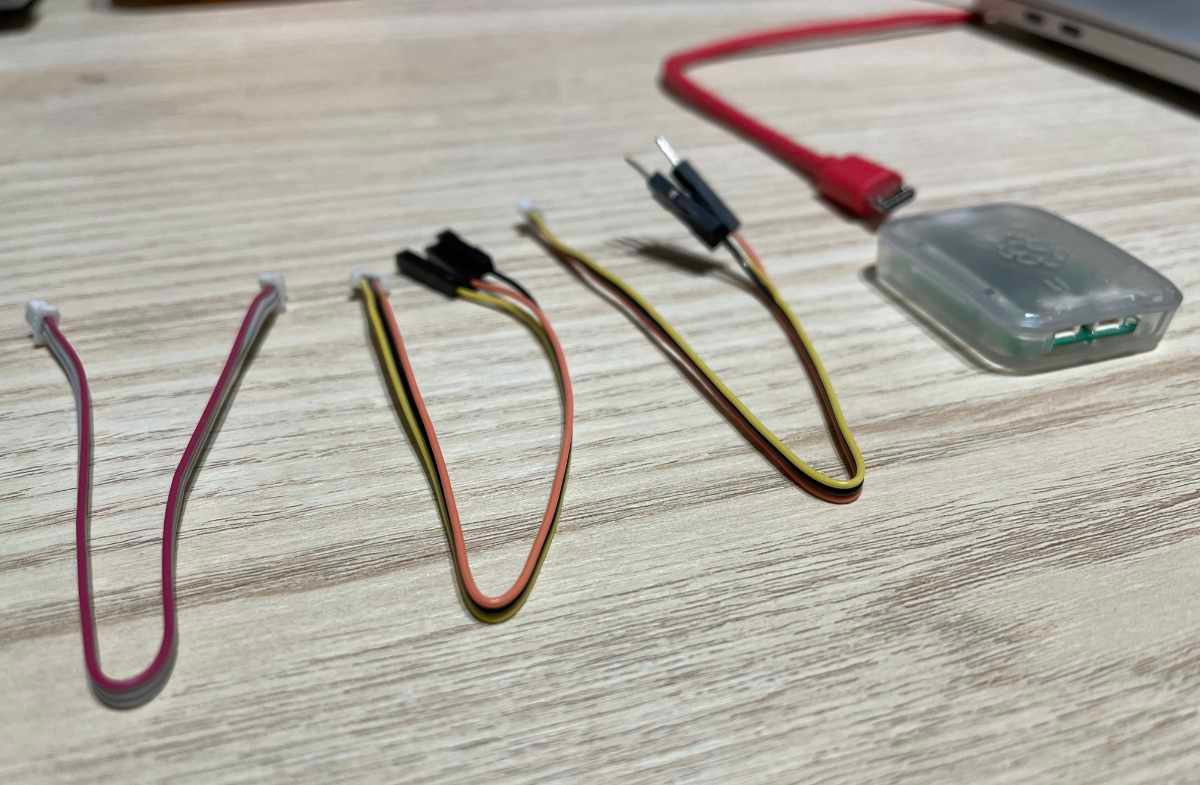
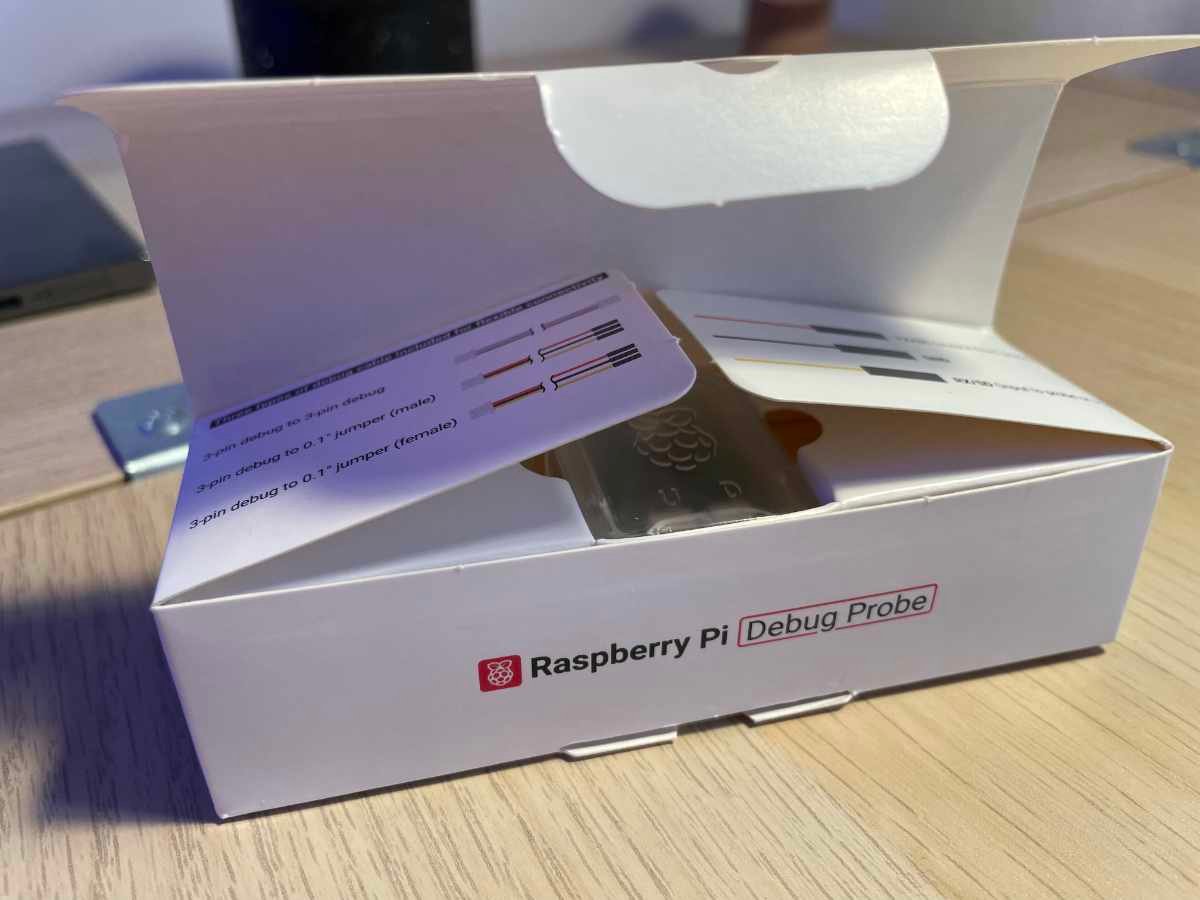
Quickly moving past our only real gripe with the hardware, we stumble upon one of the best designed packagings we’ve seen in a while. The compact rectangular box unfolds to reveal the probe itself, sitting tightly in a cardboard tray and four cables – three custom debug cables and a pleasingly red USB cable (as neatly pointed out by the “cables included” text on the top of the package). The box also features some clever design elements, such as wiring diagrams situated right on the flaps.
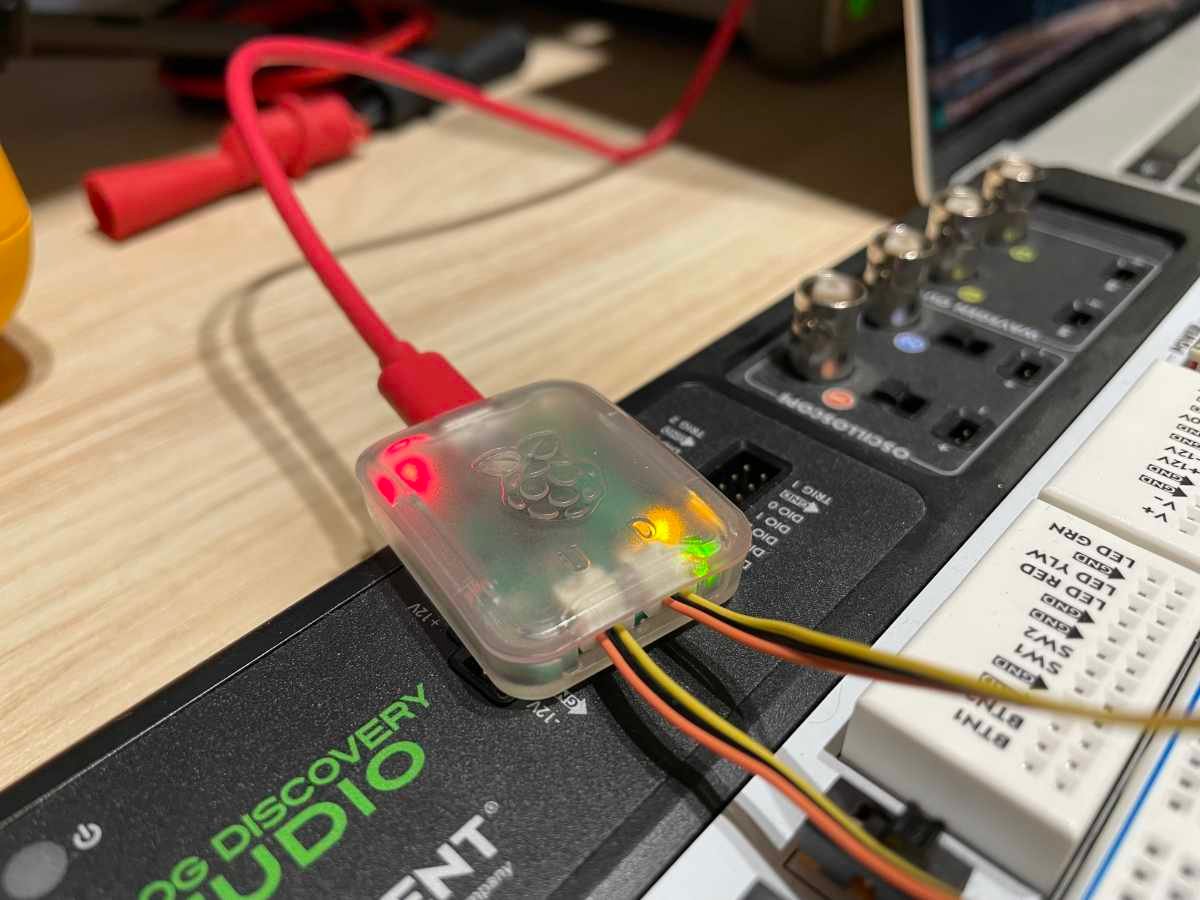
Located in the very centre of its attractive packaging is the star of the show – the Pi Debug Probe itself in all its glory. It’s a tiny board – slightly chubbier but almost half the length of the Raspberry Pi Pico. The board is encased in an adorable translucent plastic case embossed with the Raspberry logo and two letters (U and D) denoting the UART and SWD port, respectively.

We’ve mentioned multiple times that design flair isn’t a fundamentally important aspect in industrial and maker tech, but products like this one sometimes make us question our stance – the amount of polish is rather impressive – even more so when price is taken into account.
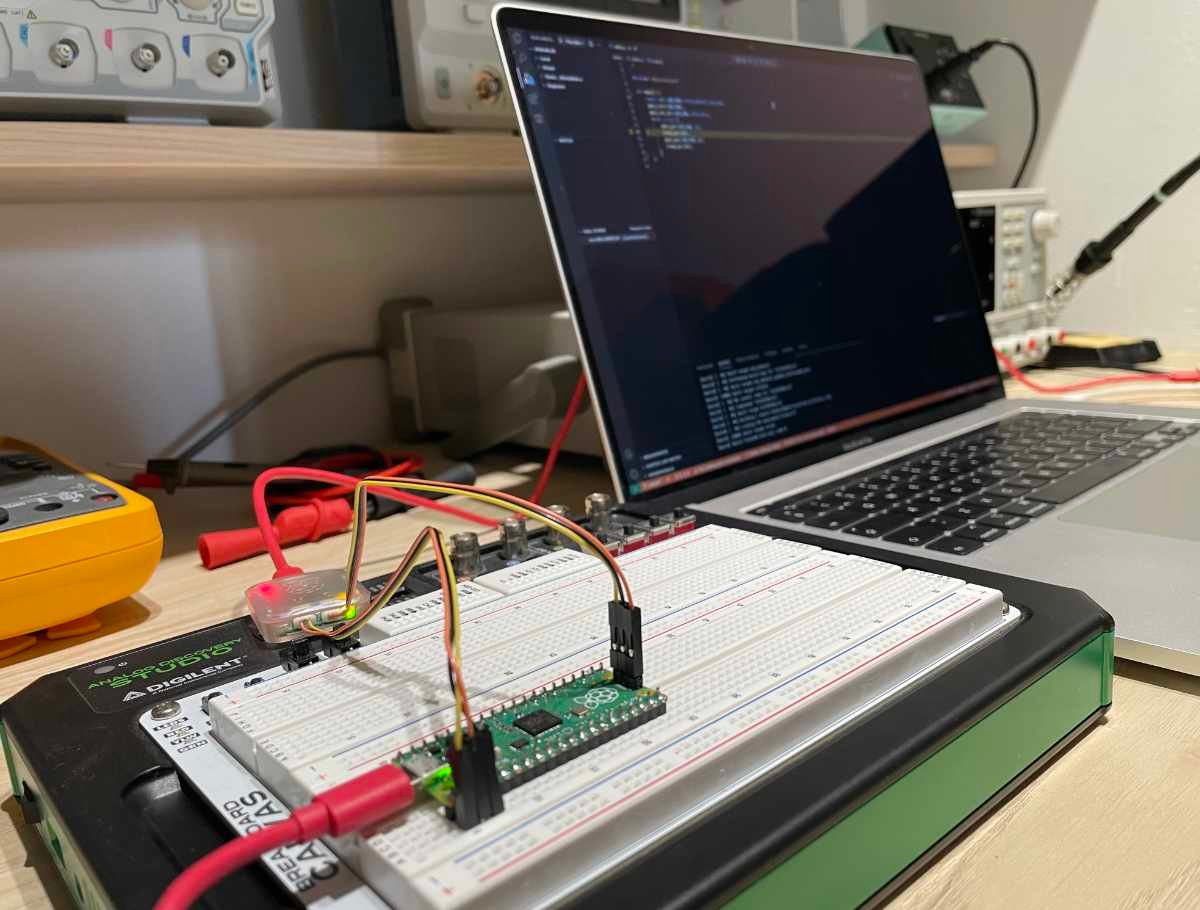
General Usage
All debug probes are rather simple devices. They’re essentially a second microcontroller tasked with collecting various data generated by the main application processor and passing it along down your toolchain, eventually feeding a debugging toolkit like GDB with the data it needs to function. What this enables is much more control over low-level code than possible through integrated IDE tools. The degree of functionality varies between models of debug probes but generally includes programming, code stepping and memory mapping. Some might offer additional interfaces, like UART or remote debugging capability enabled by internet connectivity.
Various core architectures specify various debug standards, and ARM architecture’s is called SWD. While the Raspberry Pi Debug Probe is primarily meant for use with RP2040-based boards, it’ll work just fine almost any ARM MCU (supported by the picoprobe firmware, of course).
What the Pi Debug Probe doesn’t have, however, is a full JTAG port, which is something to be kept in mind. The SWD port is essentially an ARM-specific implementation of JTAG, but the latter still reigns supreme in many widely used architectures like AVR and MSP430. Thus, as an illustrative example, none of your legendary blue 328P-based boards will be compatible. The Pi Debug Probe is a product of the modern times.
UART usage
We’ll talk about SWD stuff a bit later. Let’s first focus on the UART port which enables the probe to act as a USB-to-UART bridge. This is quite useful debugging functionality as a three-pin “debug” UART port might often be final resort when all else fails in an embedded system. Depending on the kind of debugging you’re doing, a serial comms port might be all you need.
To test its performance, we attached the probe to a wide variety of devices, with minicom as our terminal emulator, and as expected, we had no trouble sending or receiving data from the widest possible array of systems.
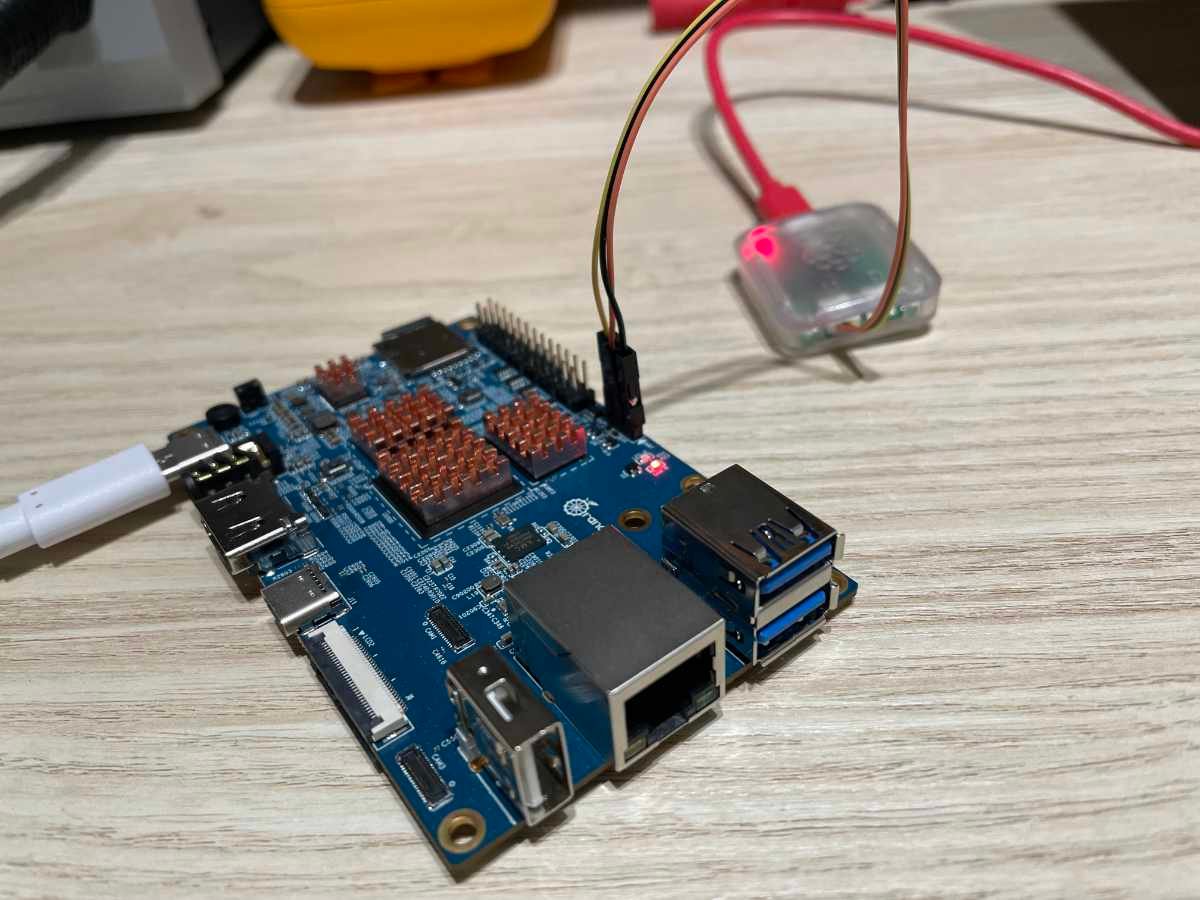
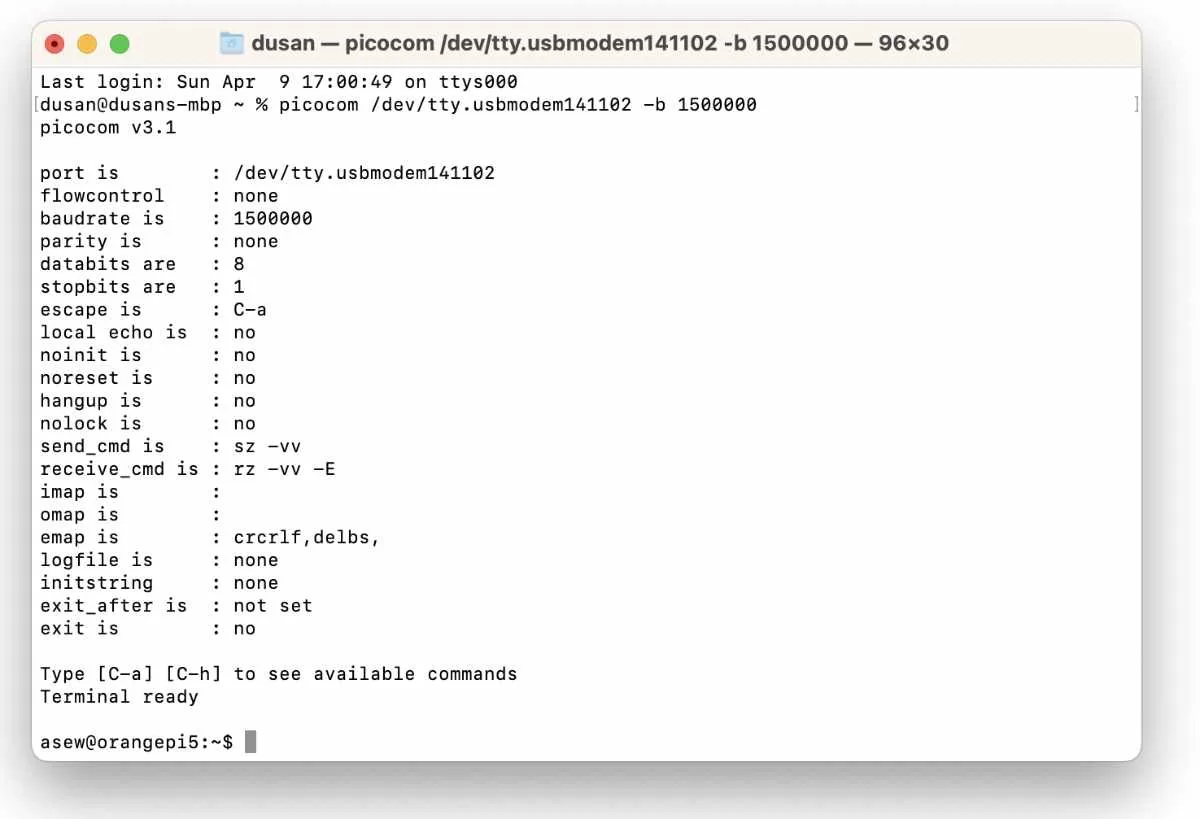
And all was well until we decided to probe the debug port of a certain RK3588S-based board. Without further elaboration, we’ll just mention a single fact: all Rockchip processors use a baudrate of 1500000 for their debug UART. That’s both a non-standard speed and ludicrously fast for a protocol which works using magic and the power of friendship (UART is notoriously loose with timing accuracy, but the protocol is designed around this – variations of a few percent in baudrate between the two communicating devices is commonplace, which is obviously much less of an issue when data isn’t hurled at some 1.5 Mbps but at the usual 9.6 kbps). All of this generates several issues: most conventional USB-to-UART cables can’t exceed 921600 baud, simply being too slow, and a lot of software really doesn’t like custom baudrates. Even the famously flexible minicom terminal emulator can’t handle it, which forced us to turn to the rather obscure picocom tool which finally let us access the console.
In the end, we managed, which was quite impressive as it demonstrated great versatility of the Raspberry Pi Debug Probe. UART communication is really a secondary function here, yet it outperforms many commercial boxes.
SWD usage
We already touched upon the theoretical functionality of a generic SWD probe. Your toolchain and user experience will greatly vary depending on your OS, target platform, language and many other factors – but given that the Pi Debug Probe is designed with the Pi Pico in mind, we’ll run through some of our experiences using the two together. We’ll use macOS here. Steps should be more or less similar for Linux users. Windows users follow a completely different set of instructions, sadly.
After cloning the official Pico SDK repository from GitHub alongside the project examples, we installed necessary software which includes OpenOCD and GDB. Getting things to work from the command line was a pretty easy feat, as Raspberry Pi seems to have leaned into using the standard CMSIS-DAP protocol instead of the custom bit-banged picoprobe one used in earlier firmware builds, which allows mainline OpenOCD versions to work with it (this is a key point to keep in mind when following older tutorials which are often written with a pair of Picos in mind – at this time the earlier protocol was in place so some things might be done differently – this is why we always recommend following the most up-to-date official documentation).
After compiling the example, we flashed the blink.elf file which immediately brought the Pico to life. We then easily attached GDB to the OpenOCD server – great.
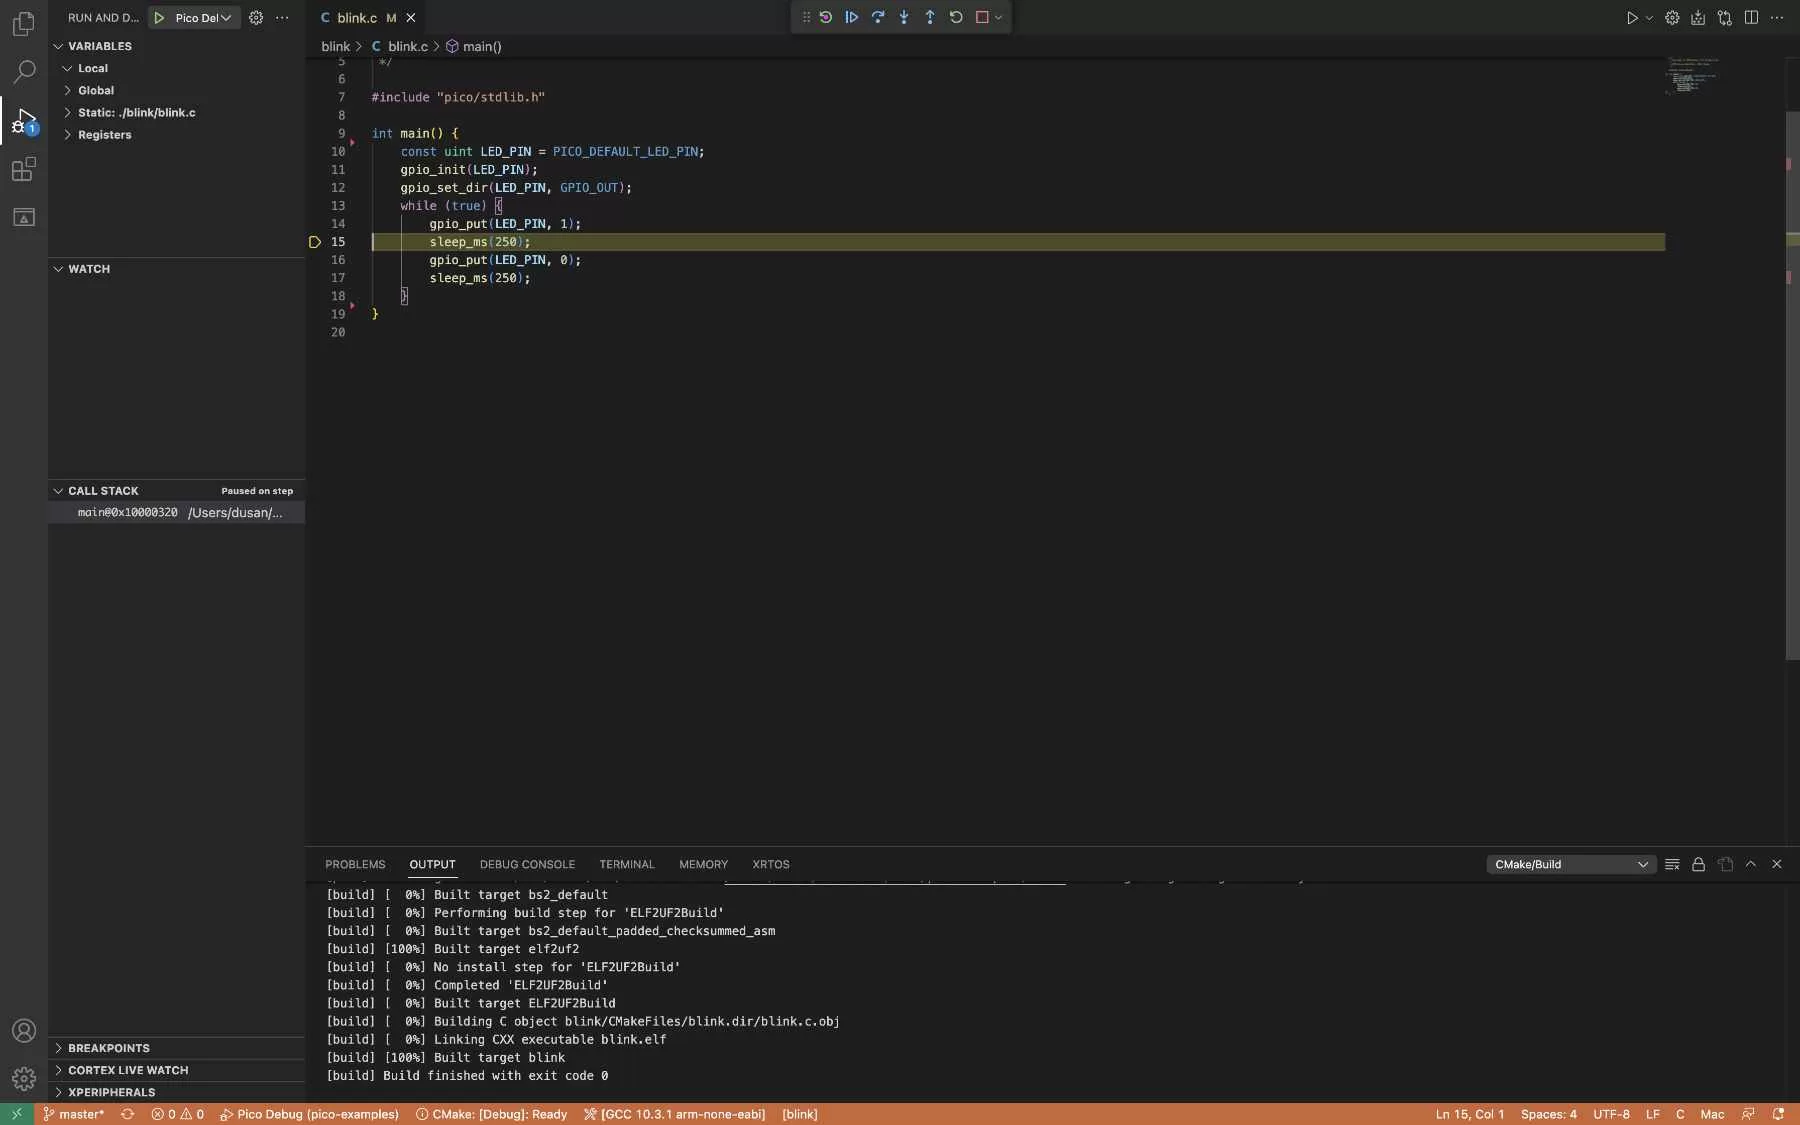
Getting Visual Studio Code to work was a bit trickier, but wasn’t Raspberry’s fault. VS Code basically acts as a graphical wrapper for the aforementioned console process. However, in order to accomplish this, it has to rely on quite a number of extensions – some of which are third-party. Additionally, the arm-none-eabi compiler needs to cross-compile, logically, making the toolchain rather complex. The amount of variables here generally makes setup just a little tricky, but after some tinkering and editing launch.json parameters, we got the debugger to successfully hook up.
After testing a few of the example programs and stepping through the code with the graphical editor, we called it a day – everything seems to work the way it should!
Note: we tested this on an Intel-based Mac, meaning that GDB was available through Homebrew. Newer ARM-based Macs have to use lldb instead of GDB here – these users’ experience might vary from ours.
Overall, all the key functionality is there. We only tested with the Pico toolchain, but we see no reason why other toolchains wouldn’t support it as well.
Conclusion
The Raspberry Pi Debug probe is a treat! We love a lot of things about it, from the packaging to the performance. We love that it’s open-source, that the company officially supports hacking together your own debug probe using the open-source firmware (in fact, this option predates the probe itself) and how simple to use it is.
The performance is also top-notch, both on the UART end and on the SWD end. While yes, some limitations exist – there’s no full JTAG port and the probe utilises the somewhat obsolete Micro USB port – it’s still a $12 debug probe. Not even a decade ago, some less capable probes sold for over $200.

Other cheap debug options exist, don’t get us wrong – from the aforementioned “Pico-with-the-right-firmware” solution to break-off STLink probes embedded in ST’s NUCLEO kits, and even cheap generic ones are available – there’s a lot of competition in the field. Still there’s nothing quite as sleek available for the price – and even SEGGER’s entry-level offerings (they, for one, match the practicality) which are much more expensive don’t offer that much more.
With the move away from the picoprobe protocol to CMSIS-DAP, the Pi Debug Probe truly deserves to call itself a full-featured debug solution for ARM development.
The $12 asking price isn’t much for such a versatile bit of kit, and we’d recommend grabbing one or two of these right away. If you’re not convinced, you can always flash the picoprobe firmware onto a Raspberry Pi Pico and try the functionality out. While you can keep using this solution, we’d seriously recommend grabbing the official probe as it eliminates cable messes you’ll have doing the former.